Plumbers, chains, and famous painters: The (updated) history of the pipe operator in R
By Adolfo Álvarez in R
September 16, 2021
Note: This post is an updated version of another I published in 2014, in a previous version of this site.
Our story starts as many other R related stories… in stackoverflow. On January 17th, 2012, an anonymous user “user4” asked the following question:
How can you implement F#’s forward pipe operator in R? The operator makes it possible to easily chain a sequence of calculations. For example, when you have an input data and want to call functions foo and bar in sequence, you can write:
data |> foo |> bar
Ben Bolker answered same day and gives what can be considered the first pipe in R:
"%>%" <- function(x,f) do.call(f,list(x))
  pi %>% sin %>% cos
## [1] 1
Although probably the first formal introduction of a pipe function in an R package occured on
April 5, 2012, when Peter Meilstrup started the package ptools as a way to collect “various data manipulation and programming utilities”. One of those utilities was the function chain, implementing a way to pipe the arguments. The package was later renamed to
vadr where the chain function can still be found.
dplyr.
But soon one of the packages that contributed to increase the popularity of the pipe use will be created: On
October 28th, 2012,
Hadley Wickham started the dplyr project on
github as an evolution of his data analysis package plyr (Initially the package was indeed called ‘plyr2’). Originally, the dplyr package didn’t incorporate a chain function, but this changed almost a year later, in October 9, 2013, when the first pipe in dplyr appeared. The function was also denominated chain, but the package introduced its first operator for the pipe: %.%. The idea behind the introduction of the chain was simplify notation for applying several functions to a data frame. Without the chain function, in dplyr you needed to read the verbs from inside out:
library(hflights)
library(dplyr)
filter(
   summarise(
     select(
       group_by(hflights, Year, Month, DayofMonth),
       Year:DayofMonth, ArrDelay, DepDelay
     ),
     arr = mean(ArrDelay, na.rm = TRUE),
     dep = mean(DepDelay, na.rm = TRUE)
   ),
   arr > 30 | dep > 30
 )
## # A tibble: 14 × 5
## # Groups:   Year, Month [10]
##     Year Month DayofMonth   arr   dep
##    <int> <int>      <int> <dbl> <dbl>
##  1  2011     2          4  44.1  47.2
##  2  2011     3          3  35.1  38.2
##  3  2011     3         14  46.6  36.1
##  4  2011     4          4  38.7  27.9
##  5  2011     4         25  37.8  22.3
##  6  2011     5         12  69.5  64.5
##  7  2011     5         20  37.0  26.6
##  8  2011     6         22  65.5  62.3
##  9  2011     7         29  29.6  31.9
## 10  2011     9         29  39.2  32.5
## 11  2011    10          9  61.9  59.5
## 12  2011    11         15  43.7  39.2
## 13  2011    12         29  26.3  30.8
## 14  2011    12         31  46.5  54.2
But when the chain function was introduced this was changed first to:
chain(
   hflights,
   group_by(Year, Month, DayofMonth),
   select(Year:DayofMonth, ArrDelay, DepDelay),
   summarise(
     arr = mean(ArrDelay, na.rm = TRUE),
     dep = mean(DepDelay, na.rm = TRUE)
   ),
   filter(arr > 30 | dep > 30)
 )
And with the %.% pipe like this:
 hflights %.%
   group_by(Year, Month, DayofMonth) %.%
   select(Year:DayofMonth, ArrDelay, DepDelay) %.%
   summarise(
     arr = mean(ArrDelay, na.rm = TRUE),
     dep = mean(DepDelay, na.rm = TRUE)
   ) %.%
   filter(arr > 30 | dep > 30)
magrittr
Nevertheless, the %.% pipe would not stay in dplyr package for long time, on December 29th, 2013, Stefan Bache revisited the old stackoverflow question proposing an alternative to the original answer:
How about
`%>%` <-
   function(e1, e2)
   {
     cl <- match.call()
     e  <- do.call(substitute, list(cl[[3]], list(. = cl[[2]])))
     eval(e)
   }
which allows a chain like:
iris %>%
  subset(., Species == "setosa", select = -Species) %>%
  colMeans(.)
## Sepal.Length  Sepal.Width Petal.Length  Petal.Width
##        5.006        3.428        1.462        0.246
Stefan continued working on this pipe operation, and on
December 30th, 2013, he implemented in github the plumbr package which included the %>% operator.
Two days later, plumbr would be renamed as magrittr, its current name, in a clear reference of the famous painting “The Treachery of Images” of the Belgian painter René Magritte.

The dplyr package was being developed in parallel but these two developments were intended to converge. In the first comment of the announcing post of dplyr by the RStudio blog in January 2014, Stefan Bache let Hadley Wickham know about the magrittr operator. After that, on March 19th, 2014 , the chain function was deprecated on dplyr, and finally on April 14th, 2014, dplyr incorporated the %>% operator of magrittr, recommending it in substitution of the original %.%, because the former is more easy to type holding down the Shift key. On August 1st, 2014, %.% was deprecated.
At the same time, on
July 31th, 2014 , the Rstudio IDE version v0.98.987 incorporated a shortcut for the dplyr/magrittr pipe operator %>% to make even more easy its use (Shift+Alt+.), but this was
soon changed to Ctrl+Shift+M, its current form.
At this point of the story I recommend you to visit a blog post from August 5th, 2014, where Stefan told about how he started magrittr.
pipeR
Another iteration of the pipe implementation in R started on April 7th, 2014, when Kun Ren published on github the pipeR package , incorporating a different pipe operator %>>%to add more flexibility to the piping process.
The package incorporates several features for the pipe, such as first argument of a function, as argument in an expression (Using .), by using a formula, or to save intermediate results (using ~), or to extract element by names (using ()):
library(pipeR)
mtcars %>>%
  (lm(mpg ~ wt + cyl, data = .)) %>>%
  (~ lm_mtcars) %>>%
  summary %>>%
  (r.squared)
## [1] 0.8302274
Currently pipeR has not been updated since 2016, but is still available on CRAN and github, in case you want to give it a try.
wrapr
On
July 2018, the
package wrappr introduced the
“dot arrow pipe” %.>% where the notation a %.>% b is nearly equivalent to . <- a; b.
For example
library(wrapr)
1:10 %.>% mean(.)
## [1] 5.5
And the lhs is still stored in the environment:
.
## [1] 1 2 3 4 5 6 7 8 9 10
Base R
Pipes in R changed completely the way how we code in R, making it more simple and readable. Therefore was a matter of time they were incorporated to the base R code. One of the first attempts was developed by
Lionel Henry, who started testing a native pipe in base R on
February, 2016. He wrote
a very recommended post about this and other proposals for the R core, imagining R 4.0 with a native pipe operator. One of the reasons for such implementation was that “native handling of the pipe would improve error recovery” because of the dependence of an external package (magrittr).
At this point we are probably missing part of the story. It seems that during the next 3 years there was no progress on this topic, although probably internal discussions happened at the R Core team. On October 5th, 2019, Antoine F. asked to the r-devel list: should base R have a piping operator ?. That question indeed provoked several replies from R developers, including Lionel Henry, Duncan Murdoch, or Luke Tierney among others.
It was actually
Luke Tierney, who in July 8, 2020, in his and Martin Mächler’s keynote at
UseR! 2020 spoke about new developments in R. A
section of the keynote was dedicated to the pipe, where he advanced that thanks to the ideas of Lionel Henry and Jim Hester, a base pipe |> was under development.
Finally, at the end of 2020, |> was born. The native pipe was
officially announced in the devel version of R, with immediate reactions in the
r-devel mailing list and in the rest of the R community (examples
here,
here,
here, and
here ). The pipe finally landed in the R stable version 4.1.0, which was released and officially announced on
May 18, 2021
Now, our first example taken from the dplyr documentation can we written as:
hflights |>
   group_by(Year, Month, DayofMonth) |>
   select(Year:DayofMonth, ArrDelay, DepDelay) |>
   summarise(
     arr = mean(ArrDelay, na.rm = TRUE),
     dep = mean(DepDelay, na.rm = TRUE)
   ) |>
   filter(arr > 30 | dep > 30)
## # A tibble: 14 × 5
## # Groups:   Year, Month [10]
##     Year Month DayofMonth   arr   dep
##    <int> <int>      <int> <dbl> <dbl>
##  1  2011     2          4  44.1  47.2
##  2  2011     3          3  35.1  38.2
##  3  2011     3         14  46.6  36.1
##  4  2011     4          4  38.7  27.9
##  5  2011     4         25  37.8  22.3
##  6  2011     5         12  69.5  64.5
##  7  2011     5         20  37.0  26.6
##  8  2011     6         22  65.5  62.3
##  9  2011     7         29  29.6  31.9
## 10  2011     9         29  39.2  32.5
## 11  2011    10          9  61.9  59.5
## 12  2011    11         15  43.7  39.2
## 13  2011    12         29  26.3  30.8
## 14  2011    12         31  46.5  54.2
In parallel, the magrittr package was still evolving but converging to the native pipe. After a transition to the tidyverse family of packages in 2016, on November 2020, the
2.0 version was released. As noticed in the announcement post, this version of magrittr incorporated a new version of the %>% pipe written in C, allowing a significant increase in speed. A deeper benchmark analysis with similar results can also be found
here.
As remarked by
this blog post of Jumping Rivers on the announcement of R 4.1 there are some differences between magrittr pipe and the native one. For example, with magrittr you don’t need to write the parenthesis at the end of the function names, while this is compulsory in the native pipe
library(magrittr)
1:10 %>% mean()
## [1] 5.5
1:10 |> mean()
## [1] 5.5
1:10 %>% mean
## [1] 5.5
1:10 |> mean
## Error: The pipe operator requires a function call as RHS
Another probably more important difference is the dot (.) replacement. By default, the pipes are passing the lhs (left-hand side) as a first argument to the rhs (right-hand side), as in the example above, where 1:10 is used as the first argument for mean(). Using magrittr pipe, the lhs can be used as any other argument of the rhs using a dot (.) where the lhs should be placed.
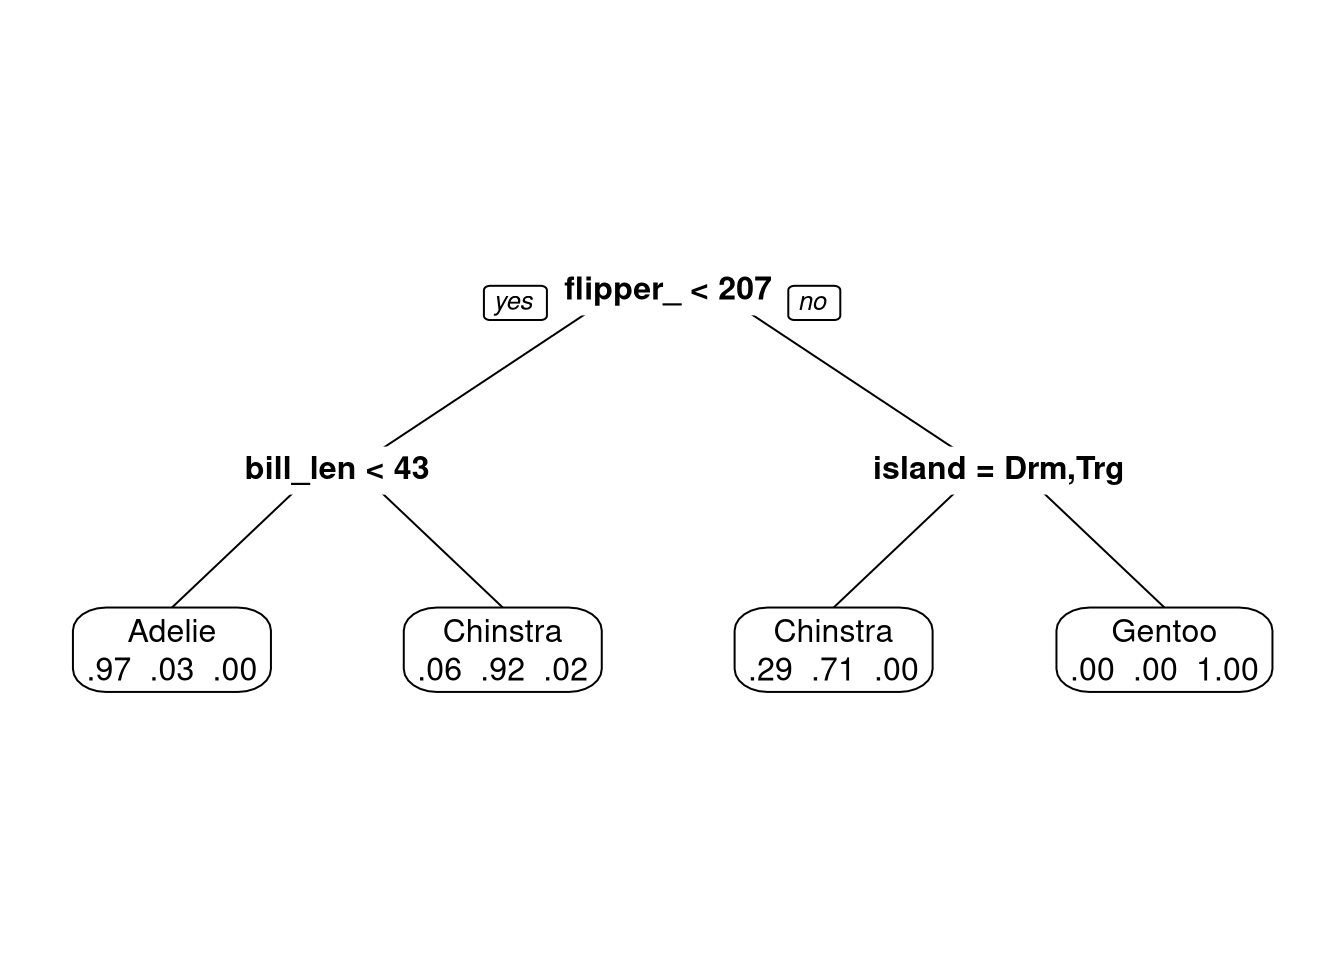
For example, while this is working with magrittr1:
library(palmerpenguins)
library(rpart)
library(rpart.plot)
penguins %>%
  rpart(species ~ ., method = "class", data = .) %>%
  prp(extra = 4)
This is not:
penguins |>
  rpart(species ~ ., method = "class", data = .) |>
  prp(extra = 4)
## Error in model.frame.default(formula = penguins, data = ., weights = species ~ : 'data' must be a data.frame, environment, or list
To make it work we need to use anothe new feature of R 4.1.0, the shorthand inline function notation \(x):
penguins |>
  {\(x) rpart(species ~ ., method = "class", data = x)}() |>
  prp(extra = 4)

While there were some ideas to introduce
a new pipe in R base => to pass the lhs to other arguments (see also
this), it is still
not officially supported.
Previous options included also using _ as a replacement for the . placeholder. We need to wait to see if that second pipe notation will be adopted, or they will choose to stay with the |> pipe and the \(x) solution.
9 years later, and as a result of the efforts and time from many R users and developers, our user4 has finally her data |> foo |> bar fully implemented in R, changing for many of us the way we are coding. I am willing to know what versions 5, 6, or 7 will bring us, thank you for reading!
Additional comments
-
The
magrittrpackage implements other three pipes (%T>%,%$%, and%<>%) -
The
data.tablepackage does not include a general use pipe, but you can pipe functions with][ -
Maybe another difference between the
magrittrpipe and the base R one is pronunciation: While Hadley Wickham stated that the%>%pipe should be pronounced as “then”, we can clearly hear Luke Tierney on his User! keynote read|>as “goes into”. -
The pipe
|>is also implemented in other languages such as Elixir, Julia, Javascript and F#. -
The pipe
|>was originally proposed by Tobias Nipkow in May 1994 for the proof assistant Isabelle/ML.
-
Notice that
penguinsis placed in the data argument, while a dot in the first argument,species ~ ., is ignored since a dot in a formula means something different. ↩︎